Better iTerm: System status bar
Live system status chart for CPU, RAM, Network, Battery usage at the top of your terminal

For some reasons I need to know how much resources my cli tools are consuming on my M1 MacBook Air. Yet, Activity Monitor or htop do not quite fit my use case due to the smaller screen size.
So I try to go for this approach which I like a lot.

In order to turn on the system status bar, you need to enabled it in your iTerm2 Preferences. A quicker way to open the Preference panel, use the command + , shortcut key.
Then, go to Profiles , select your default profile, then go to the Session tab, find and check the Status bar enabled checkbox.
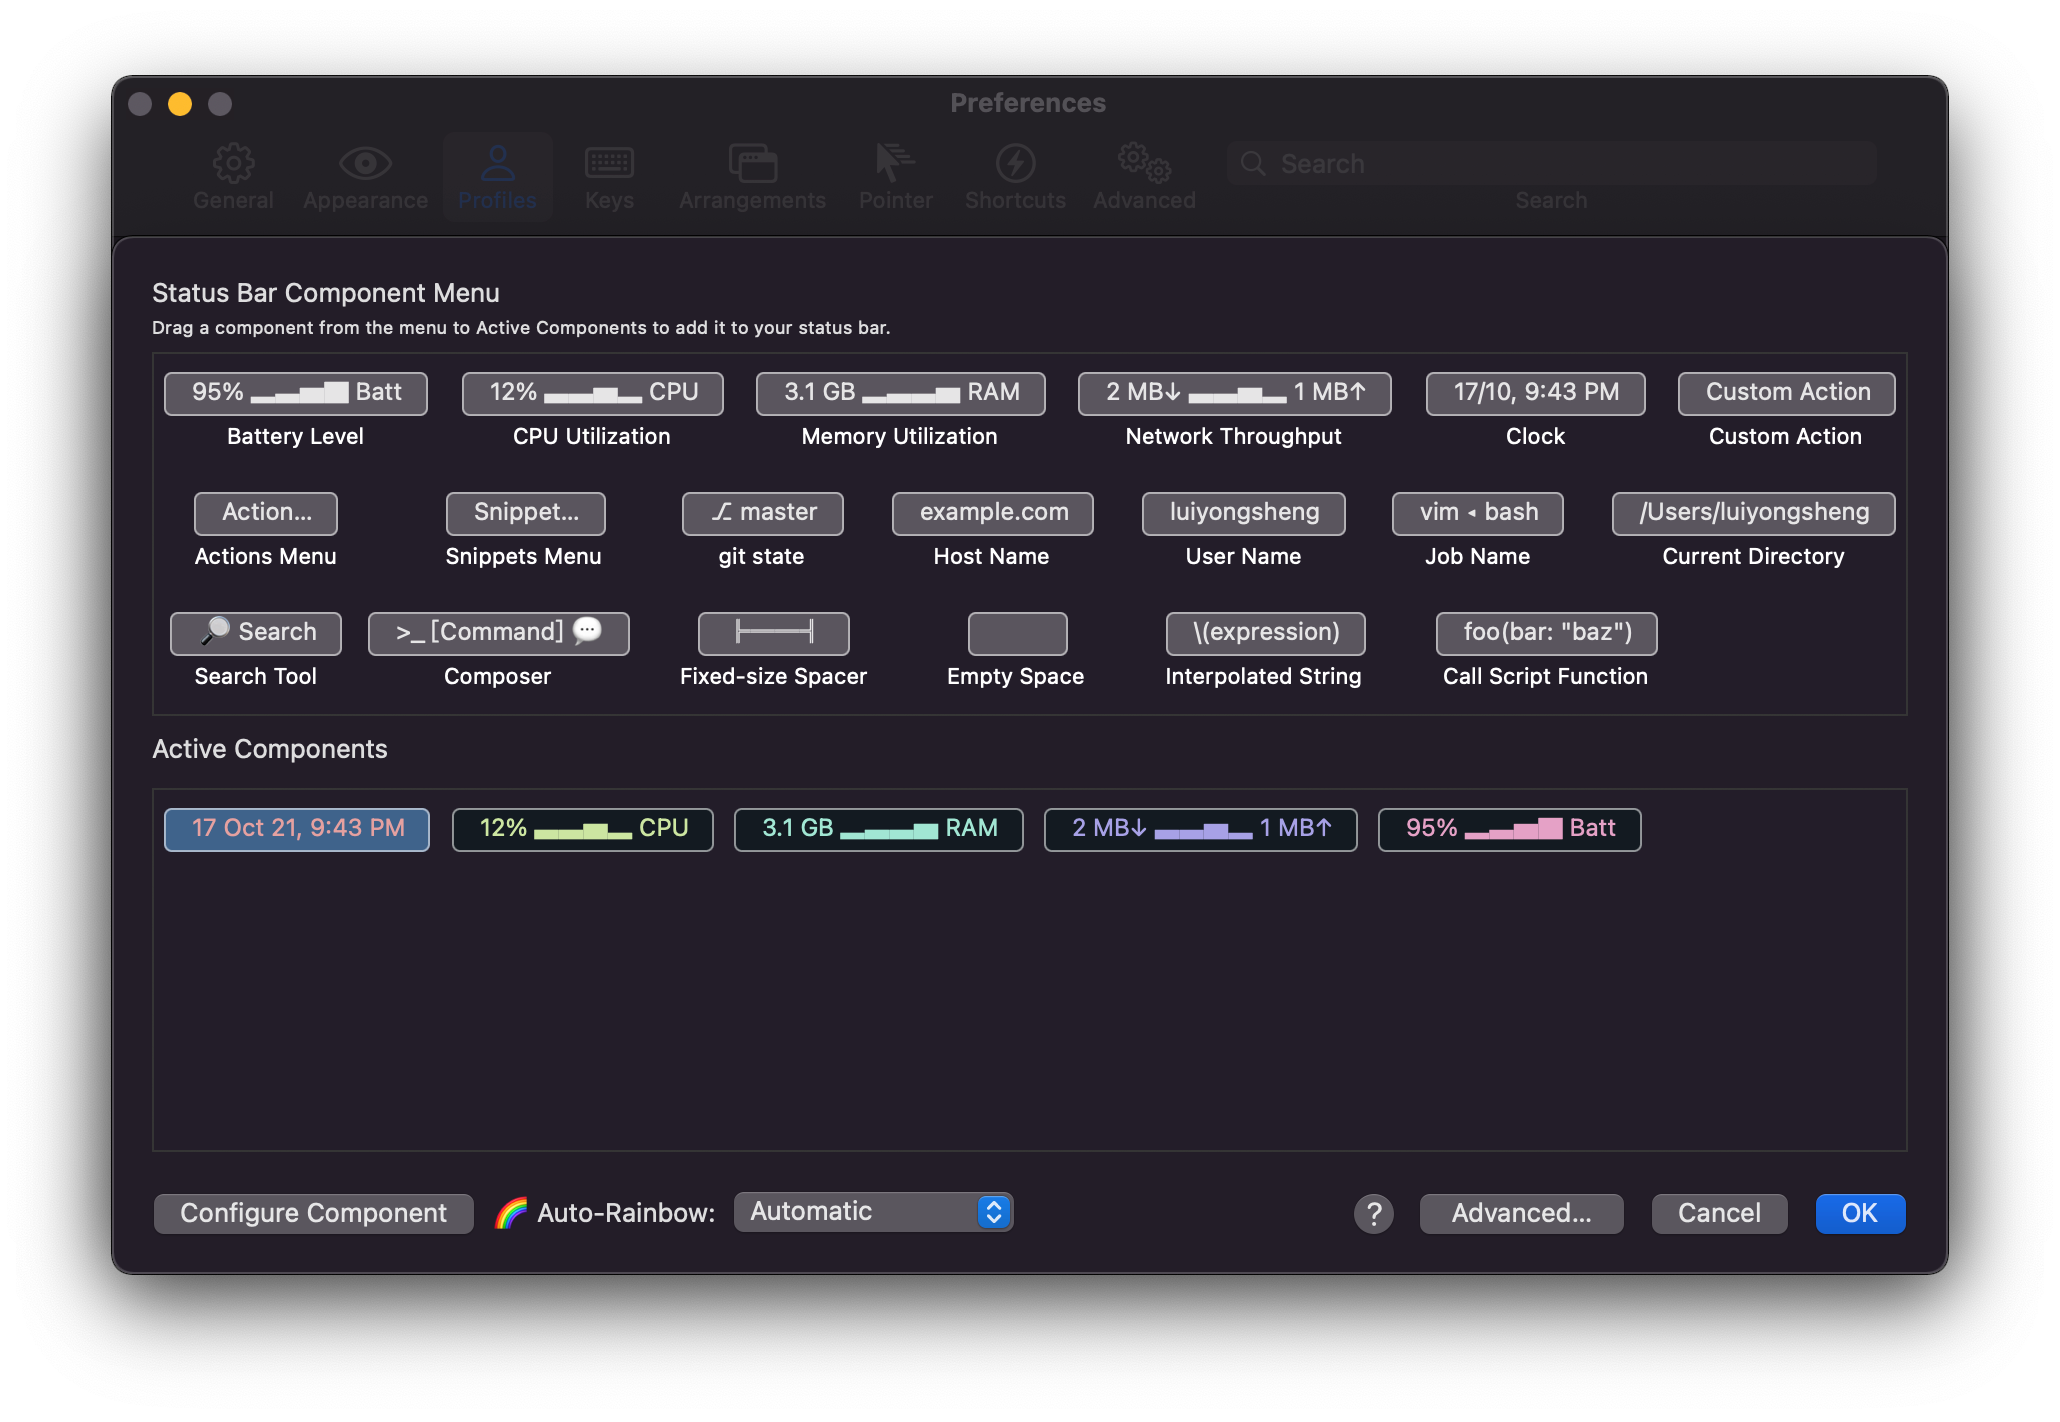
You status bar is now ready. But before you close the Preference window, you need to configure the Status Bar to display the information that fit your need.
To do so, simply click the Configure Status Bar button.

For me, I just need the information about CPU, RAM, Network, and Battery usage pair with the current date time. So I just drag and drop the relevant components into the Active Components area.
However, I prefer a different date time display format. To change that, select the Clock component in your Active Components area and click the Configure Component button.


The format I’m using is dd-MMM-YY h:mm . You can tweak it to your liking. This Clock component is using the Unicode TR35 Date Format Patterns. Here are some of the examples:
EEE, MMM d, ''yy   -   Wed, July 10, '96
yyyyy.MMMM.dd GGG hh:mm aaa   -   01996.July.10 AD 12:08 PM
hh 'o''clock' a, zzzz   -   12 o'clock PM, Pacific Daylight Time
Other than date time format, you can also configure the minimum & maximum width of the component when displayed.
When you saved all the changes, you may need to restart your iTerm 2 to see the changes applied.
Resources

